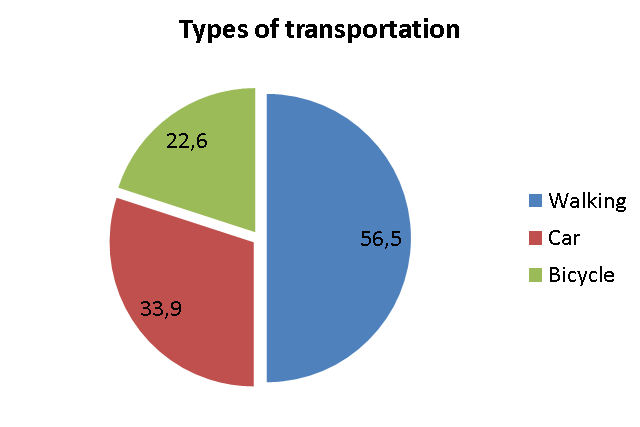
This pie chart shows the percentages of types of transportation used by the 113 students to come to Salvador Espriu school*
a) How many students come to school by bicycle?
b) How many students do not walk to school?
c) How many students come to school in a car?
*the data used may not be real
(1) 22,6
(2) 55,15
(3) 33,9
1) Its go to school 22,6 students in bicycle.
2) Its go to school 56,5 students don’t walk.
3) Its go to school 33,6 students in car.
🙂 🙂
its go to school22,6 students of bicycle
its go to school56,5 students dont walk
its go to school33,6 students on car
1- With bike sold 22.6.
2- With car sold 33.9.
3- sold 56.5 foot.
🙂
3- sold 56,5 walk.**
4- 56,5 dont walk.
22,6 bike
56,5 car
56,5 foot
1-go to school 22,6 students in bicycle.
2-go to school 56,5 students don’t walk.
3-go to school 33,6 students in car.
1-I ts go to school 22,6 students in bicycle
2-I ts go to school 56,5 students don’t walk
3-I ts go to school 33,6 students in a car
1) Its go to school 26 students in bicycle. Aprox.
2) Its go to school 64 students don’t walk. Aprox.
3) Its go to school 38 students in car. Aprox
Im the first 🙂 🙂 🙂 🙂 🙂
1)22,6/100=0,226 x 113= 25
Its go to schol 25 students in bicycle Aprox.
2)56,5/100 =0,655 x 113=64
64 students don’t walk Aprox.
3)33,9/100=0,339 x 113=38
Its go to schol 38 students in car Aprox.
22,6 students come with bicycle
33,9+26,6=60,5 not walk to the schcol
33,9come With car
22,6/100=0,226 x 113= 25
Its go to school 25 students in bicycle Aprox.
2)56,5/100 =0,655 x 113=64
64 students don’t walk Aprox.
3)33,9/100=0,339 x 113=38
Its go to school 38 students in car Aprox.
1-go to school 26 students in bicycle.(Aprox.)
2-go to school 64 students don’t walk.(Aprox.)
3-go to school 38 students in car.(Aprox.)
1- Go to school 22,6 students in bicycle. 🙂
2- Go to school 56,5 students don’t walk. 🙂
3- Go to school 33,6 students in car. :/
4- I have not copied anyone 🙂
1 22. 6 vaisicol
2 56.5 font walk
3 33.6 car
????
1. 22.6% 113×22,6/100=25
2.56,5% 113×56,5/100=64
3. 33,9% 113×33,9/100=38
a)- Go to school 22,6 students in bicycle.
b)- Go to school 56,5 students don’t walk.
c)- Go to school 33,5 students in car.
i have not capied