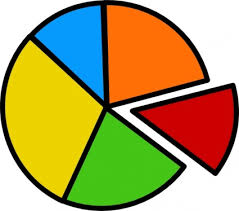
What is a Pie Chart?
Pie charts are circle graphs divided into sectors, each pie sector displaying the size of some related piece of information. Pie charts are used to show the relative sizes of the parts of a whole.
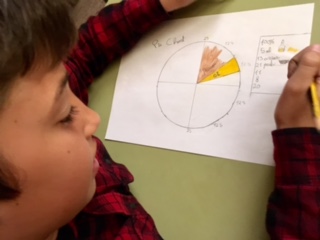
A week of December at La Farigola School students were collecting food to help “Banc dels aliments”
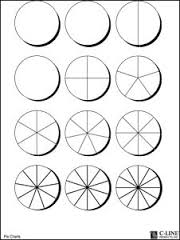
We scored the products were collected and now in the English class students build a graphic pie chart to see the information more clearly.